
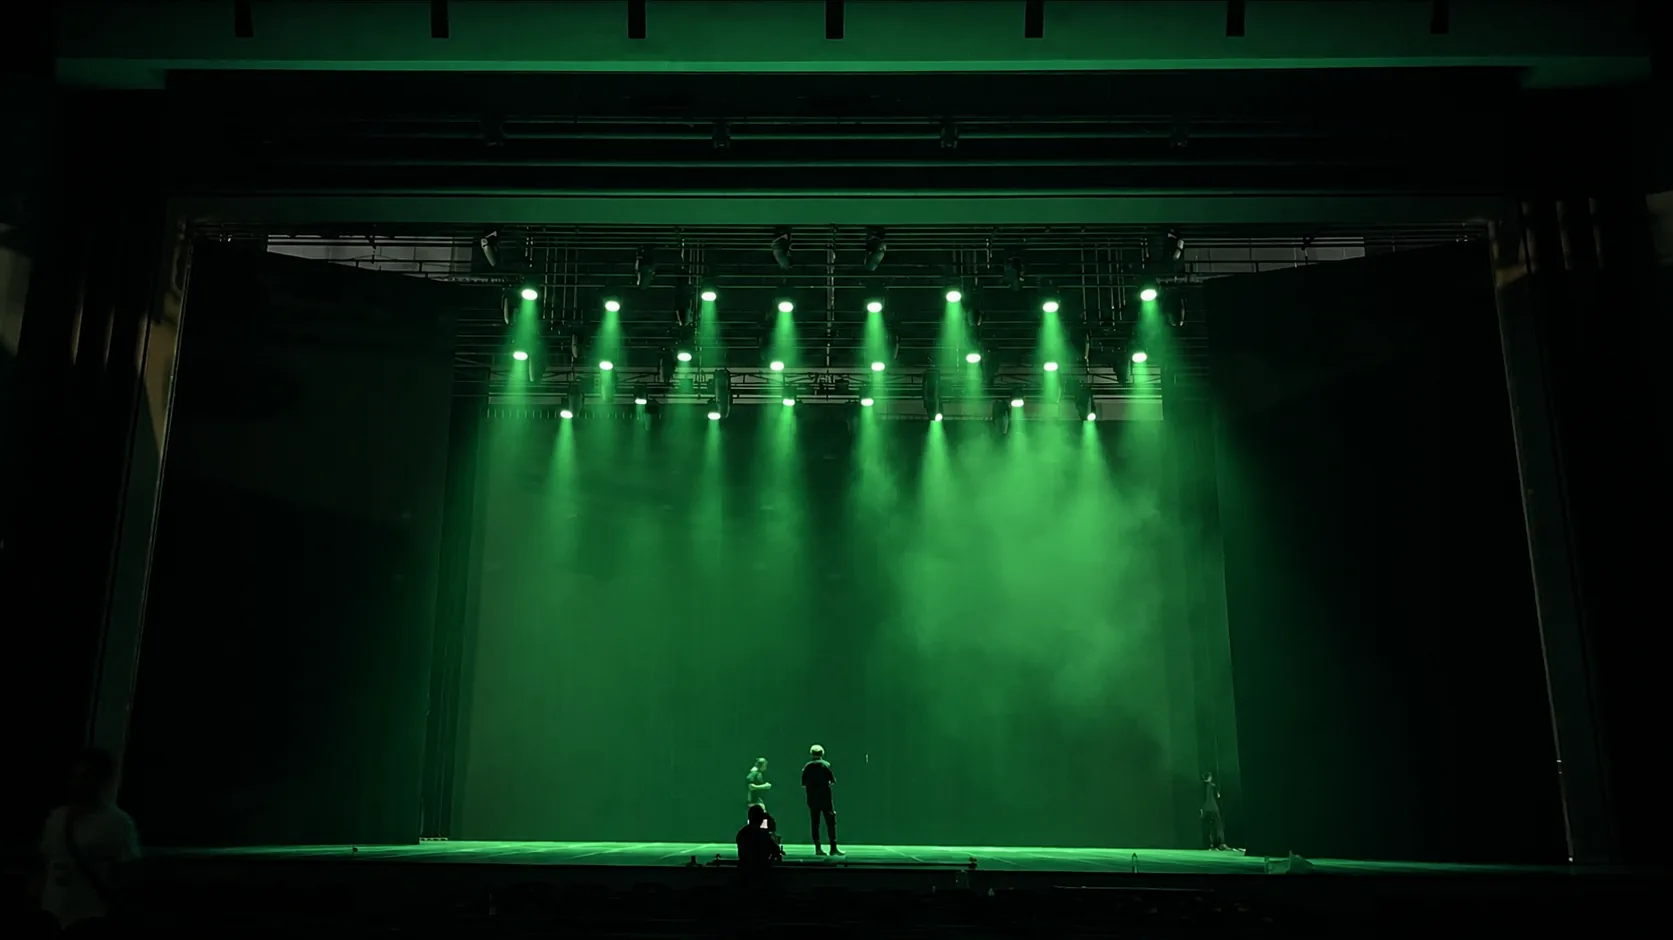
Comparison begins with conditions
Start with the Test State, Not the Largest Lux Number
A lux value is useful only when the fixture state, distance, target plane and measurement method are clear.
Moving head wash photometrics often compress several decisions into one table: the selected lens or zoom position, the active color channels, the dimmer level, the throw distance and the point at which the meter was placed. If any of those conditions differ, the two numbers may answer different questions even when both are labelled lux.
The primary keyword for this guide, zoom wash moving head beam angle, is therefore only one part of the comparison. A narrow endpoint can raise center illuminance while reducing the footprint; a wide endpoint can cover more surface while lowering the central reading. Neither result describes edge quality, average illuminance or the usable field by itself.
- Exact model and production configuration
- Zoom endpoint or recorded zoom control value
- Beam-angle or field-angle definition
- Color state, white mix, dimmer and strobe state
- Throw distance measured along the optical axis
- Target-plane orientation and meter positions
- Fixture stabilization, ambient conditions and test date
One table can contain different quantities
Separate the Seven Photometric Terms
Angle, illuminance and coverage terms should stay distinct throughout a product comparison.
- Beam angle
- The full included angle between two directions where intensity reaches the stated central-beam boundary. CIE TN 010 defines beam angle for a directional light at the 50% points of centre beam intensity. Read the report's own convention before applying the number.
- Field angle
- A wider included angle. The IES definition uses directions where intensity is 10% of the maximum in a plane through the nominal beam centerline. Non-symmetrical fields may need angles in two perpendicular planes.
- Center lux
- Illuminance measured at the optical-axis point on the target plane. It describes one location. It is not a field average and cannot describe uniformity on its own.
- Average illuminance
- The arithmetic mean of illuminance readings across a stated grid and measurement plane. The grid boundary, point spacing, exclusions and ambient-light treatment must be recorded for the average to be repeatable.
- Usable field
- The portion of the projected field that meets the production's chosen minimum illuminance, uniformity, color, edge and camera requirements. It is an application criterion rather than a universal fixed percentage.
- Throw distance
- The optical path from the luminaire's photometric center or stated measurement reference to the target point. For a tilted fixture, this is not the horizontal floor distance.
- Zoom endpoint
- A recorded narrow or wide mechanical position, angle or control value used for a test. Endpoint data should identify whether the setting was reached from the same travel direction and whether the stated angle is beam or field angle.
These terms answer different questions. Beam and field angles describe angular boundaries. Center lux describes one illuminated point. Average illuminance describes a set of readings. Usable field applies a production criterion to those readings and observations. Throw and zoom define the operating geometry.
The same degree symbol can describe different widths
Beam Angle vs Field Angle: Read the Boundary Before the Degree Value
A field-angle diameter is normally wider than a beam-angle diameter because it follows a lower intensity boundary.
CIE TN 010 describes beam angle as a full angle measured between the two 50% points of centre beam intensity. The IES field-angle definition uses the 10%-of-maximum directions. Those boundaries are not interchangeable, and neither should be replaced by the outermost spill visible in haze or on a dark wall.
| Item | Beam angle | Field angle | Practical use |
|---|---|---|---|
| Common boundary | 50% of centre beam intensity | 10% of maximum intensity | Identify which convention the table uses |
| Relative width | Brighter central region | Wider lower-intensity region | Do not compare diameters unless boundaries match |
| Non-circular field | May need horizontal and vertical values | May need horizontal and vertical values | Record both planes instead of forcing one circle |
| Relationship to usable field | May be smaller or larger than the accepted area | Often includes edges below the project criterion | Set an explicit acceptance threshold |
| Relationship to visible haze | Not the same as the apparent aerial cone | Not the outer visible spill | Use a meter and marked target for surface data |
A multi-cell wash can also produce an irregular, oval or structured field. In that case a single angle can hide useful information. Ask for orthogonal intensity data, an illuminance grid or an IES-format distribution where appropriate, and inspect the actual field at narrow, middle and wide zoom positions.
One point cannot describe an area
Center Lux Is Not Average Illuminance
Center lux can help compare intensity at a controlled state, but a wash is normally selected for the area it illuminates.
Illuminance is luminous flux incident per unit area and is expressed in lux. A center reading records illuminance at the optical-axis point. It may be the maximum reading, but the optical axis and the peak-intensity direction do not always coincide in complex distributions. The location of the reading must therefore be defined rather than assumed.
Average illuminance needs a declared target area and grid. Add the accepted readings and divide by the number of included points, but retain the individual values. The mean can hide a hotspot, dark corners or an uneven edge. Report minimum and maximum readings, point locations and a ratio such as minimum-to-average only when the grid and acceptance method are also stated.
| Metric | It can help answer | It cannot establish alone |
|---|---|---|
| Center lux | How much illuminance reaches the center at one state and distance | Average output, edge quality, uniformity or usable coverage |
| Average illuminance | Mean level across a defined grid | The location of hotspots, dark points or color separation |
| Minimum illuminance | Weakest measured point inside the declared area | Whether the full visual field is attractive or well blended |
| Maximum illuminance | Strongest measured point in the grid | Total lumens or performance at another zoom and color state |
| Minimum-to-average ratio | One view of distribution across that grid | A universal pass criterion for every stage application |
Geometry places test marks; photometry fills them with data
Calculated Coverage Diameter vs Actual Light-Field Measurement
The beam-diameter formula estimates where an angular cone reaches a perpendicular plane. It does not measure the light inside that circle.
The formula assumes a symmetrical cone meeting a flat target perpendicular to the optical axis. It produces a beam-boundary diameter if the input is a beam angle, or a field-boundary diameter if the input is a field angle. It cannot tell you whether the edge is smooth, whether the center is hot, whether individual cells create structure or whether the resulting wash meets a camera or scenic requirement.
Actual moving head wash coverage comes from a measurement plane. Mark the calculated center and boundary as starting locations, then place a grid across and beyond them. Record lux at every point, inspect color and edge behavior, and draw the usable boundary using the acceptance criteria set for the production. If the fixture is tilted, the footprint on a floor or wall becomes stretched and the near and far edges sit at different throws.
| Record | Input | Output | Correct label |
|---|---|---|---|
| Geometric calculation | Throw and stated angle | Estimated diameter on a perpendicular plane | Calculated beam or field diameter |
| Center measurement | Fixture state, distance and center point | One illuminance reading | Measured center lux |
| Grid measurement | Fixture state, plane, grid and meter | Point-by-point illuminance distribution | Measured field grid |
| Application decision | Grid data plus visual and camera criteria | Accepted operating area | Usable field for the stated criterion |
Useful for controlled distance changes
Use the Inverse-Square Relationship Carefully
Inverse-square scaling can estimate how illuminance changes with distance when intensity and geometry remain equivalent.
The IES inverse-square definition states that illuminance on a surface normal to the incident light varies directly with point-source intensity and inversely with the square of distance. This makes the relationship useful for a quick consistency check or for moving a center-lux reading between two sufficiently distant points under the same operating state.
- Do not use the relationship to compare different zoom positions.
- Do not use it to compare white, saturated colors or mixed colors as though intensity were unchanged.
- Do not apply a center result to field-edge points with a different intensity distribution.
- Do not ignore target tilt; cosine effects and different near-to-far distances change the result.
- Do not treat a large finite aperture as a point at very short distance.
- Do not ignore haze, dust, atmospheric loss, stray light or meter limitations in a field test.
If a table's readings do not scale approximately with the squared distance ratio, investigate rounding, meter position, near-field geometry, zoom repeatability, thermal behavior and transcription before using the table for a project. The calculation is a diagnostic tool, not a substitute for a complete intensity distribution.
A single state is not total fixture performance
Zoom Endpoint, Color Mixing and Dimmer State Can Change the Result
A complete Zoom Wash comparison needs more than one angle and one full-output white reading.
At the narrow zoom endpoint, the optical system may concentrate light into a smaller angular region. At the wide endpoint, it spreads output over a larger field. Middle positions matter because many productions operate there, and lens movement can change field shape or mixing behavior in ways that two endpoint values do not show. Record the angle or control value used at every position.
RGBW and RGBL engines also need state-specific data. Red, green, blue, white, lime, full additive output and console-created whites do not have identical spectral power or drive behavior. Optical mixing, calibration, thermal limits and channel balancing can change center lux, field distribution and color across the same zoom position. The letters RGBW or RGBL do not predict the result.
| Variable | States to include | Why it matters |
|---|---|---|
| Zoom | Narrow endpoint, one repeatable middle position, wide endpoint | Shows concentration, distribution and working-range behavior |
| Primary colors | Individual channels used in the production | Reveals output differences and field color behavior |
| White state | Native white channel, calibrated white or defined RGB mix | Prevents two unlike white recipes from being compared |
| Show colors | Two or more common mixed colors | Connects the table to real cues rather than one laboratory state |
| Dimmer | Full plus one lower recorded level | Checks whether distribution remains stable away from full output |
| Thermal state | After the same stabilization period | Keeps warm-up and thermal control from becoming hidden variables |
If product architecture, optics, color system and control still need to be shortlisted, begin with How to Choose an LED Wash Moving Head, then use this photometric method on the remaining models.
Normalize conditions before ranking performance
How to Compare Two Zoom Wash Photometric Tables
A useful comparison sheet makes differences visible instead of silently converting unlike conditions into a single winner.
| Comparison line | Fixture A | Fixture B | Decision rule |
|---|---|---|---|
| Exact identity | Record model, hardware and software | Record model, hardware and software | Stop if the table cannot be tied to the offered configuration |
| Test document | Record laboratory, date and method | Record laboratory, date and method | Prefer complete reports with environmental and instrument information |
| Zoom state | Record narrow, middle or wide plus angle/value | Record narrow, middle or wide plus angle/value | Compare equivalent positions or keep results in separate rows |
| Angle boundary | Beam, field or another percentage | Beam, field or another percentage | Do not compare diameter until the boundary matches |
| Color state | Record active channels and white recipe | Record active channels and white recipe | Compare the same defined color state |
| Dimmer / strobe | Record exact state | Record exact state | Use steady output at the same recorded level |
| Test distance | Record optical throw | Record optical throw | Use direct matches or cautious inverse-square scaling only when other conditions match |
| Center lux | Enter the stated center reading | Enter the stated center reading | Treat it as one point, not area performance |
| Field grid | Enter average, minimum, maximum and point map | Enter average, minimum, maximum and point map | Compare only grids with the same plane, boundary and spacing |
| Usable-field rule | Record threshold and application | Record threshold and application | Apply one project criterion to both distributions |
| Missing line | Leave blank | Leave blank | Request the missing test or run the same sample procedure; do not invent a value |
Once the rows match, compare performance in the order the application needs it: usable field at the working throw, minimum and average illuminance on the target, center lux, color behavior and zoom transition. A model with the highest center lux may be the weaker wash if the accepted area is smaller or the edge falls below the production threshold.
Use the current Aolait Zoom Wash Moving Head range to build the product shortlist. Keep collection-page specifications separate from measured photometric entries unless a model-specific report states the same configuration and operating state.
Create comparable data instead of filling gaps
A Repeatable Test Method When Reliable Measured Data Is Not Available
A controlled sample test is the correct response when a complete model-specific photometric report is unavailable.
Nine-step Zoom Wash field test
- 01Define the acceptance plane
Choose the scenic wall, stage floor or vertical performer plane. Record its dimensions, orientation and surface condition.
- 02Control the environment
Reduce stray light, record ambient illuminance and avoid changing haze, dust or reflective objects during the measurement sequence.
- 03Set the fixture geometry
Measure from the stated luminaire reference to the target along the optical axis. Align the axis perpendicular to the plane for a baseline test.
- 04Stabilize operation
Use the same warm-up period, supply condition, operating mode and ventilation clearance for every fixture and state.
- 05Record the cue
Save zoom, focus if present, pan, tilt, color channels, dimmer, strobe, software and control personality. Approach zoom endpoints consistently.
- 06Mark the grid
Place a center point, orthogonal axes and evenly spaced points across and beyond the expected beam and field boundaries.
- 07Measure illuminance
Use a suitable calibrated lux meter oriented to the measurement plane. Record every point, ambient reading, meter identity and calibration date.
- 08Publish the complete table
Keep individual grid readings, center, average, minimum, maximum, angle criterion, field dimensions, photographs and operating notes together.
A laboratory goniophotometric report provides angular intensity distribution and stronger control of test conditions. A site grid answers a different question: how the exact sample performs at the intended plane and cue. Use the laboratory report for product characterization and the field grid for the real application; do not label a site snapshot as a complete luminaire photometric file.
Make the report usable after the demonstration
What to Request in a Zoom Wash Photometric Package
A complete package lets lighting professionals reproduce the comparison and connect it to a stage plan.
- Exact model, hardware, software and optical configuration
- Supply voltage, ambient conditions, mounting orientation and stabilization time
- Photometric center, optical axis and target-plane definition
- Narrow, middle and wide zoom states with recorded angle definitions
- Center illuminance by distance for clearly named color states
- Beam and field angles with the intensity percentage used for each
- Orthogonal or full distribution data for non-circular fields
- Grid readings with center, average, minimum, maximum and point spacing
- IES or LDT file when applicable to the design workflow
- A sample-test cue sheet matching the intended console and show colors
- A product-page link and contact path for configuration questions
The Aolait AL1950WX product page provides a relevant Zoom Wash model route for product configuration and enquiry. Treat its published zoom and color-engine specifications as setup information; enter photometric values only from a matching report or controlled sample test.
The goal is not to collect the largest number. It is to establish which fixture state produces the required moving head wash coverage, illuminance and field quality at the real throw, with enough detail that another technician can repeat the result.
RECOMMENDED PRODUCTS
Models to evaluate against your brief
We organize model-specific product facts and available technical files to support fixture comparison and project planning.
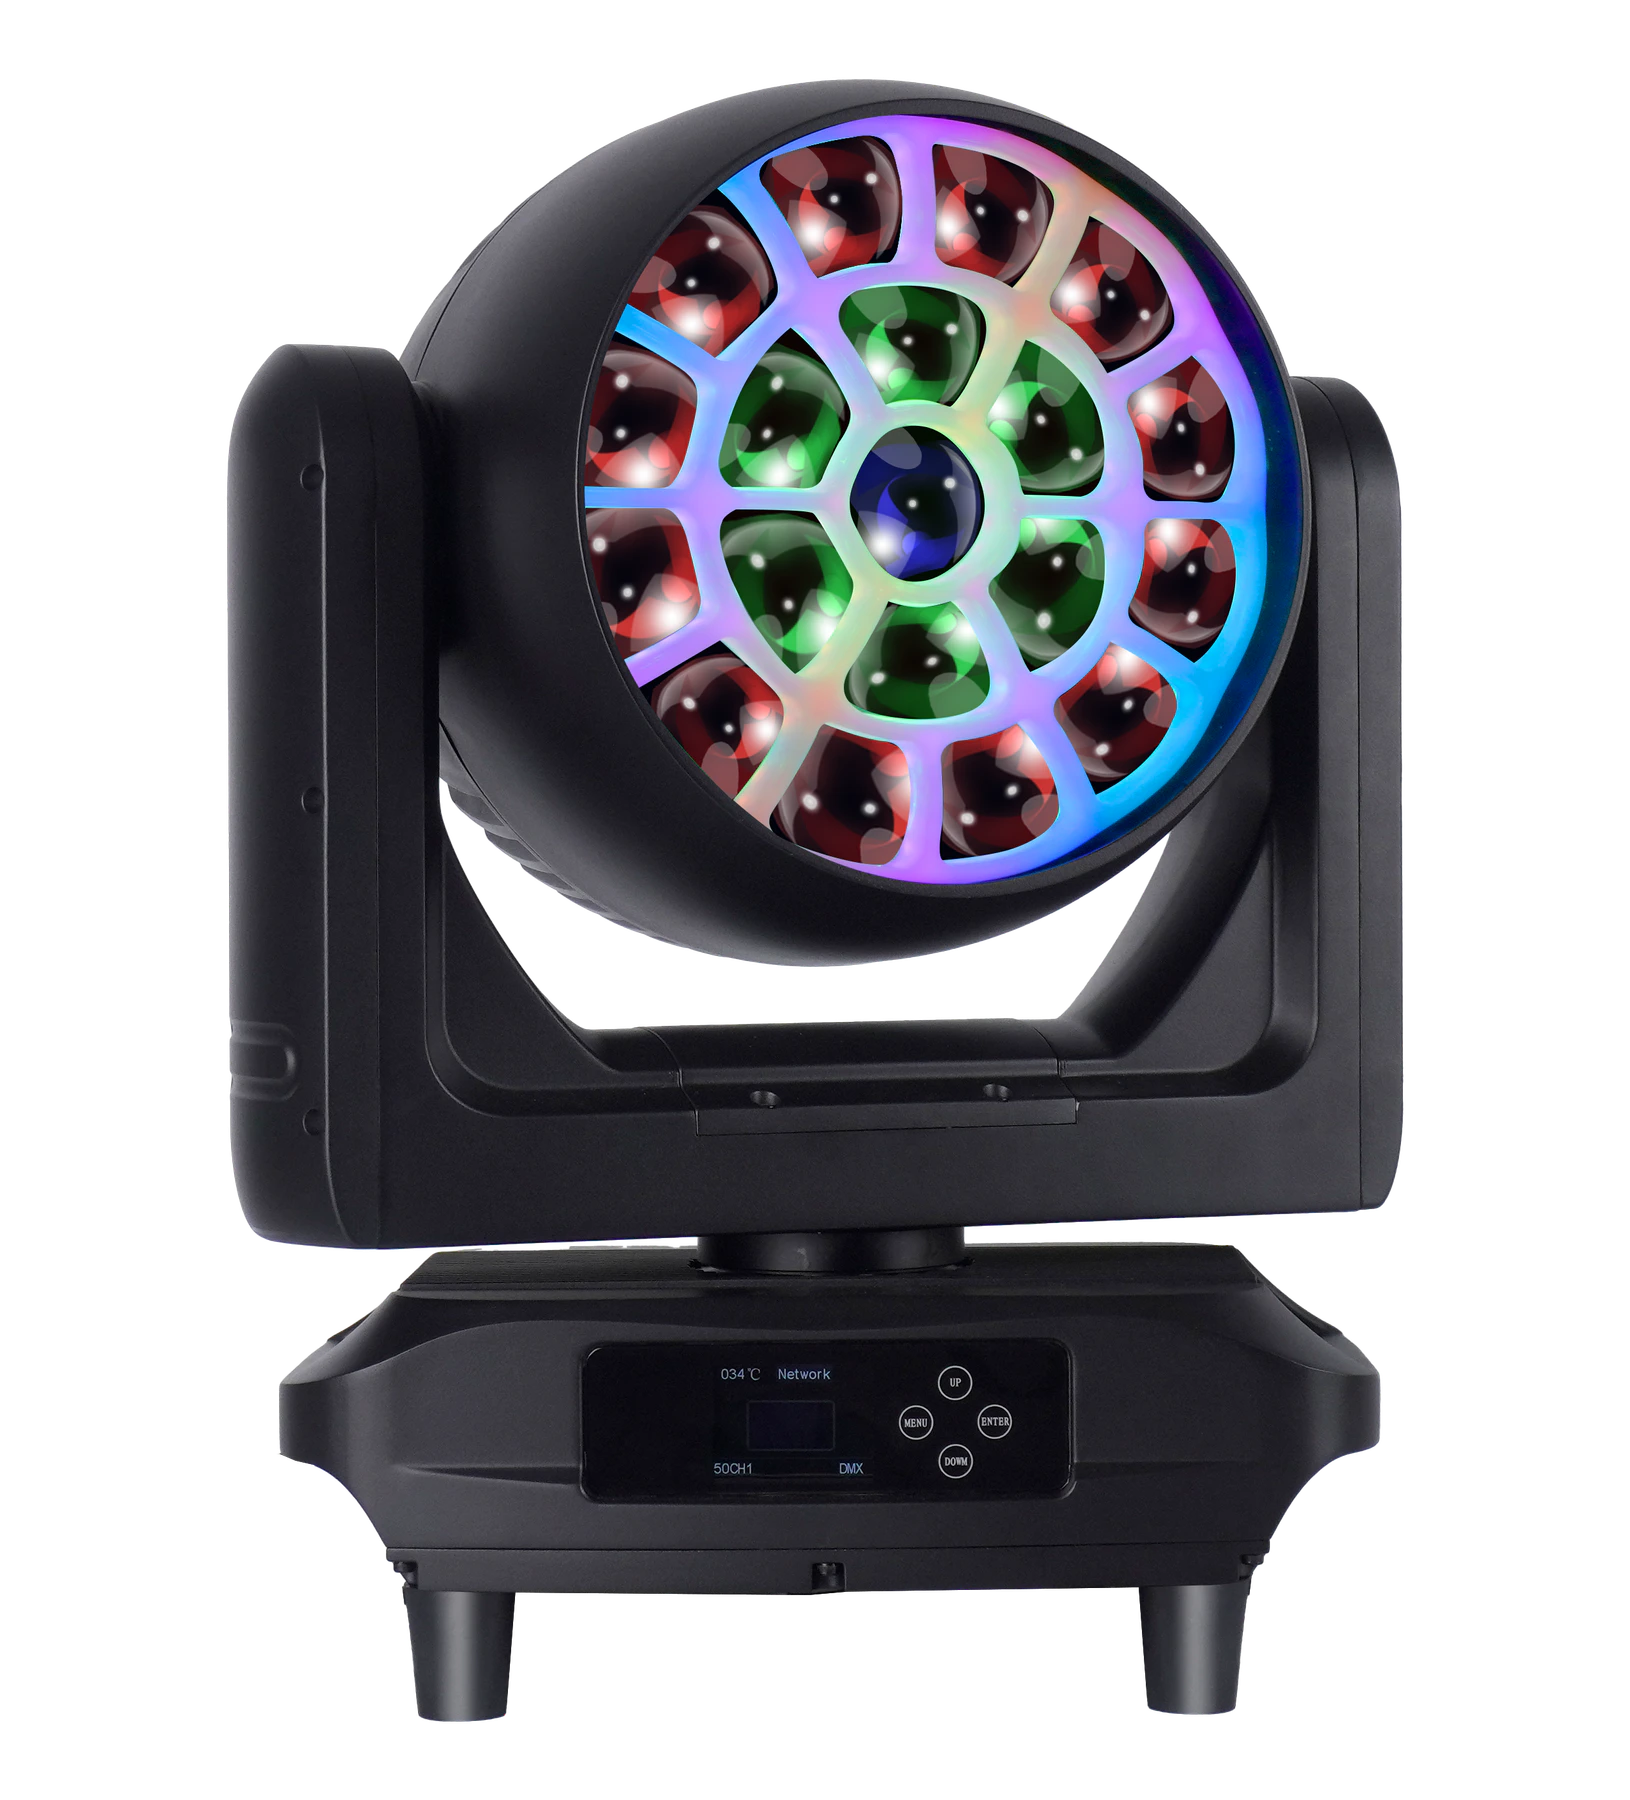
19×50W RGBL LED Wash Moving Head
A nineteen-cell RGBL Zoom Wash platform for planning a controlled narrow, middle and wide position comparison with the same fixture configuration and cue sheet.
- 19 × 50W RGBL main engine
- 6°–55° motorized zoom
- DMX, RDM, Art-Net and sACN
FREQUENTLY ASKED QUESTIONS